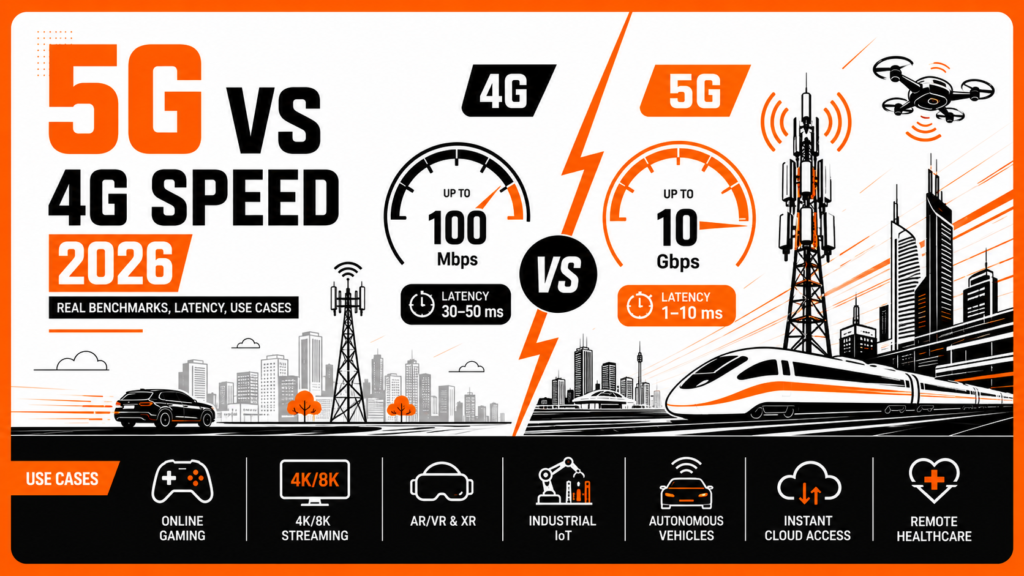
5G is typically 3 to 6 times faster than 4G LTE in real-world 2026 performance tests. According to Ookla H2 2025 data, T-Mobile’s median 5G download speed reached approximately 309 Mbps, while most 4G LTE networks generally deliver between 30 and 100 Mbps.
Typical 5G latency falls between 30 and 50 milliseconds, improving responsiveness for applications such as gaming, video calls, and real-time cloud services. Whether upgrading to 5G is worthwhile depends heavily on factors such as spectrum band availability, Standalone (SA) vs Non-Standalone (NSA) architecture, and the specific device use case.
Most people see a 5G icon on their phones every day, but very few are actually experiencing the full performance that modern 5G networks can deliver. In 2026, the gap between 5G vs 4G is finally measurable in real-world benchmarks, not just carrier marketing claims. With nationwide 5G Standalone (SA) rollouts expanding, mid-band spectrum deployments accelerating, and new technologies like 5G RedCap entering the IoT market, the difference between 4G LTE and 5G network speed has become increasingly important for consumers, enterprises, and connected device manufacturers.
So how fast is 5G compared to 4G in real-world conditions? Is 5G worth it for streaming, cloud gaming, AR and VR, industrial IoT, and connected vehicles? And why do some users still see 4G-like speeds even when their phones display a 5G signal?
This guide breaks down the latest 2026 5G vs 4G speed data using benchmarks from Ookla, Opensignal, RootMetrics, and 3GPP standards. We compare real-world 5G speeds, 5G latency, upload performance, mmWave vs sub-6 GHz, and the growing performance gap between 5G SA vs NSA architectures. We also explain where 4G LTE still performs well, where 5G delivers meaningful advantages, and how businesses should evaluate NB-IoT, LTE-M, 5G RedCap, and private 5G networks for modern IoT deployments.
Whether you are choosing a carrier, upgrading devices, optimizing enterprise connectivity, or planning an IoT product roadmap, this guide explains what 5G performance actually looks like in 2026, beyond the marketing headlines.
How Fast Is 5G Compared to 4G in 2026?
5G is faster than 4G in every credible measurement, but the gap is narrower than carrier marketing suggests and wider than skeptics claim. The theoretical peaks tell one story: 4G LTE-Advanced caps at about 1 Gbps and 5G New Radio caps at about 20 Gbps. The real world tells a different story.
According to Ookla Speedtest Intelligence H2 2025 (the Best Mobile Network assessment published in February 2026), the median 5G download speed in the United States is:
| Carrier | Median 5G Download | Median 5G Upload | Median 5G Latency | Position |
|---|---|---|---|---|
| T-Mobile | 309.41 Mbps | 13.57 Mbps | 44 ms | Leader across overall nationwide 5G performance metrics |
| Verizon | ~199 Mbps | ~10 Mbps | ~50 ms | Strongest mmWave peak-speed performance in dense urban areas |
| AT&T | ~140 Mbps | 7.9 Mbps | ~67 ms (improving) | Broad nationwide standalone (SA) 5G rollout |
Sources: Ookla H2 2025 Connectivity Assessment (Feb 2026); Opensignal January 2026 USA Mobile Network Experience Report.
For comparison, median 4G LTE downloads in 2026 cluster around 30 to 100 Mbps depending on carrier and location. Peak 4G LTE-Advanced performance occasionally reaches 200 Mbps on lightly loaded cells. RootMetrics reported nationwide median mobile download speed rose to 276 Mbps in H2 2025, up from 212 Mbps in H2 2024, with 5G availability at nearly 90 percent of all tests.
The practical takeaway: median 5G is 3 to 6 times faster than median 4G in 2026 US tests. The gap is widest on T-Mobile (which deployed mid-band 2.5 GHz aggressively after the Sprint merger) and narrowest on AT&T (which only completed its nationwide 5G Standalone rollout in late 2025).
Most carrier marketing highlights mmWave 5G achieving speeds near 1 Gbps, but most real-world users rarely connect to mmWave coverage. Instead, the majority of traffic runs on mid-band 5G, particularly sub-6 GHz C-band and 2.5 GHz spectrum, which typically deliver 150 to 500 Mbps under good network conditions. That is the practical performance range most IoT product teams should design and capacity-plan around.
What Is 5G Latency Compared to 4G Latency?
Latency is the time it takes a packet to make a round trip between your device and the network. For real-time applications like cloud gaming, video calls, AR and VR, and industrial control, latency matters more than raw bandwidth.
Real-world latency numbers from 2026 measurements:
| Network Type | Median Latency | Best Case | Use Case Fit |
|---|---|---|---|
| 4G LTE | 50 to 70 ms | ~30 ms | Voice, web browsing, video calls |
| 5G NSA (non-standalone) | 30 to 50 ms | ~20 ms | Streaming, light gaming |
| 5G SA (standalone) | 20 to 30 ms | 10 to 15 ms | Cloud gaming, AR, live operations |
| URLLC (ultra-reliable low-latency) | Not deployed yet | 1 ms (lab) | V2X communications, factory automation |
Sources: Ookla H2 2025; 3GPP Release 17 and Release 18 specifications; Opensignal benchmarks.
The 44 ms median latency T-Mobile recorded for its 5G network in Ookla H2 2025 reflects a mix of NSA and SA deployment. Pure 5G SA networks consistently deliver lower latency because the entire control plane runs on a 5G core rather than borrowing from 4G LTE.
A 30 ms latency improvement provides little value for a soil moisture sensor transmitting data once per hour. However, it becomes critical for applications such as autonomous mobile robots, vehicle-to-everything (V2X) messaging, and remote industrial machine control. This is exactly why technologies such as 5G RedCap and URLLC network slices exist as specialized IoT tiers. In practice, the correct architecture for IoT is rarely “use 5G everywhere”, but rather matching the network capability to the actual operational requirement.
mmWave vs Sub-6 vs Low-Band 5G: Three Different Networks Sharing One Name
The single biggest misconception about 5G coverage is that 5G is one network. It is three, and the difference between them is the difference between 1 Gbps and 50 Mbps on the same phone.
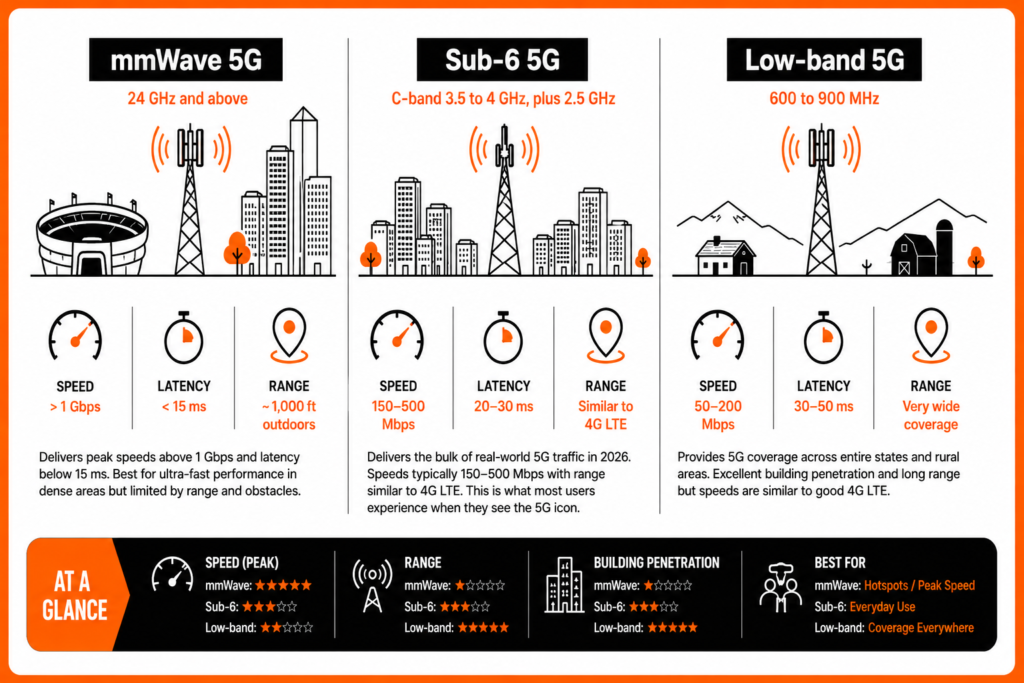
mmWave 5G (24 GHz and above)
Delivers peak speeds above 1 Gbps and latency below 15 ms. It is the speed your carrier advertises. Its weakness is range and penetration. A single mmWave cell covers about 1,000 feet outdoors and struggles to pass through walls, foliage, or heavy rain. mmWave 5G is concentrated in stadiums, airports, downtown cores, and select dense neighborhoods.
Sub-6 5G (C-band 3.5 to 4 GHz, plus 2.5 GHz)
Delivers the bulk of real-world 5G traffic in 2026. Real-world speeds range from 150 to 500 Mbps depending on cell load and distance. Range is similar to 4G LTE. This is what most people experience when their phone shows the 5G icon.
Low-band 5G (600 to 900 MHz)
Provides 5G coverage across entire states and rural areas. It penetrates buildings well and reaches across large distances. The catch: peak speeds are typically 50 to 200 Mbps, which is comparable to a good 4G LTE signal. The 5G icon stays lit, but the speed is not very different from what you had before.
If your phone displays a 5G icon while connected only to low-band spectrum, the actual performance may feel very similar to 4G LTE. Carriers often keep the 5G indicator visible whenever technically possible, even when speeds are modest. To verify real-world performance, run a test using Ookla Speedtest or Opensignal. The network icon is ultimately a marketing label, not a guaranteed measure of speed or latency.
5G SA vs NSA: The Performance Gap Carriers Rarely Mention
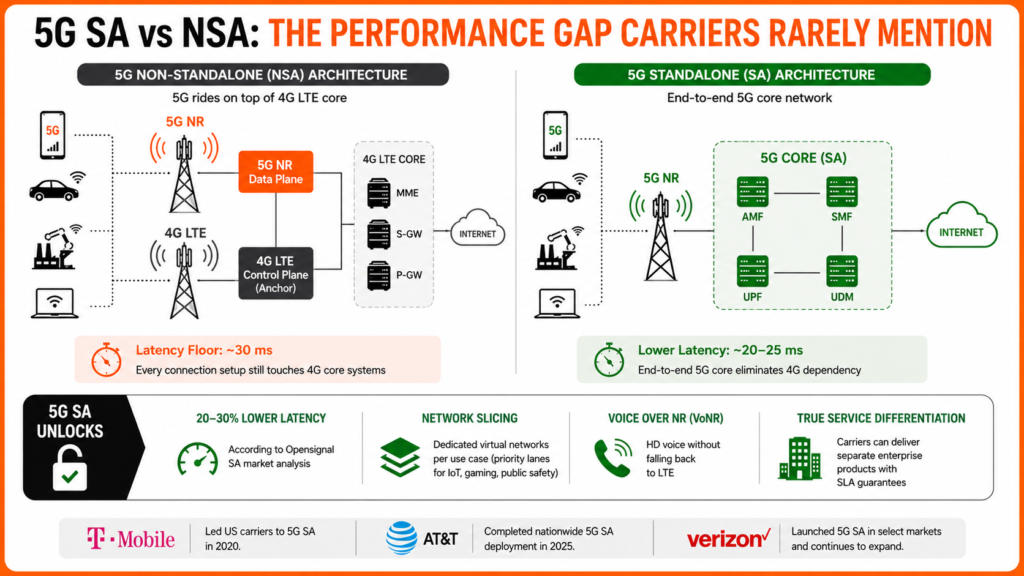
Most 5G in the United States still runs on Non-Standalone Architecture (NSA), where the 5G radio rides on top of a 4G LTE control plane. NSA was the quickest path to 5G branding for carriers, but it caps the latency floor at around 30 ms because every connection setup still touches 4G core systems.
5G Standalone (SA) uses an end-to-end 5G core network. It unlocks:
- 20 to 30 percent lower latency compared to NSA, according to Opensignal SA market analysis.
- Network slicing: dedicated virtual networks per use case (priority lanes for IoT, gaming, public safety).
- Voice over New Radio (VoNR) for HD voice without falling back to LTE.
- True service-level differentiation that carriers can sell as separate enterprise products.
T-Mobile led US carriers to 5G SA in 2020. AT&T completed its nationwide 5G SA deployment in 2025, validated in the Opensignal January 2026 report. Verizon has launched 5G SA in select markets but is still expanding.
Network slicing only functions on 5G Standalone (SA) cores. This enables organizations to deploy dedicated network slices optimized for specific operational requirements. For example, a logistics company can purchase a low-latency slice for connected vehicles, a hospital can deploy a high-reliability slice for medical telemetry, and a factory can run an isolated industrial slice for AGV and automation control.
None of these capabilities are fully achievable on 5G NSA (Non-Standalone) architectures because NSA still depends on the underlying LTE core network. If your IoT roadmap includes deterministic SLAs, mission-critical telemetry, or real-time control loops beyond 2027, the carrier’s 5G SA deployment progress is one of the most important metrics to evaluate.
When Is 5G Worth It? The Use Case Decision Matrix
The honest answer for most consumers and businesses: it depends on what you are actually doing. The matrix below maps real-world use cases to bandwidth, latency, and the verdict on whether 5G earns its place.
| Use Case | Bandwidth | Latency Need | 4G Enough? | 5G Recommended? |
|---|---|---|---|---|
| Email, web, social | <5 Mbps | 100 ms ok | Yes | Optional |
| HD video streaming (1080p) | 5 to 8 Mbps | 100 ms ok | Yes | Optional |
| 4K video streaming | 25 Mbps | 100 ms ok | Sometimes | Yes for stability |
| Cloud gaming (xCloud, GeForce Now) | 35 Mbps | <30 ms | No | Yes, 5G SA preferred |
| Live streaming and broadcast | 10 to 25 Mbps up | <50 ms | Sometimes | Yes for upload stability |
| AR and VR over network | 50 to 200 Mbps | <20 ms | No | Yes, mid-band or mmWave |
| Video conferencing (HD) | 3 to 6 Mbps | <150 ms | Yes | Optional |
| Connected vehicle V2X | Variable | <10 ms | No | Yes, URLLC slice required |
| Smart city sensors | <100 Kbps | Tolerant | Yes (NB-IoT or LTE-M better) | No (overkill) |
| Industrial robotics, AGVs | 10 to 100 Mbps | <5 ms | No | Yes, private 5G SA |
| HD security cameras | 2 to 10 Mbps per cam | 200 ms ok | Yes | 5G RedCap optimal |
| Asset tracking, telematics | <50 Kbps | Tolerant | Yes (LTE-M ideal) | No |
The pattern is clear. 5G earns its place when latency falls below 30 ms or sustained high bandwidth is required. For everything else, 4G LTE remains a competent network in 2026.
When 4G Is Still Enough (Defeating the 5G FOMO Narrative)
A typical US 4G LTE connection in 2026 delivers 30 to 100 Mbps down, 10 to 30 Mbps up, and 50 ms latency. That is enough for:
- All web browsing, email, and social media use.
- Music streaming on Spotify, Apple Music, and Tidal at maximum quality.
- Video calling on FaceTime, Zoom, Google Meet, and Teams at HD.
- Standard and 1080p video streaming on Netflix, YouTube, and Disney+.
- Voice calls with VoLTE, which delivers HD audio on 4G.
- Most enterprise IoT sensor networks (fleet telematics, smart meters, retail kiosks).
- Mobile point of sale and field service tablets.
If your daily use sits in this list, a 5G upgrade is a nice-to-have rather than a need. The biggest 5G benefit for casual users is consistency in dense urban areas during peak hours, where 4G can degrade under load. Outside those windows, the difference is marginal.
US Carrier 5G Speed Comparison: T-Mobile vs Verizon vs AT&T in 2026
Based on Ookla H2 2025 Connectivity Assessment and Opensignal January 2026 USA report:
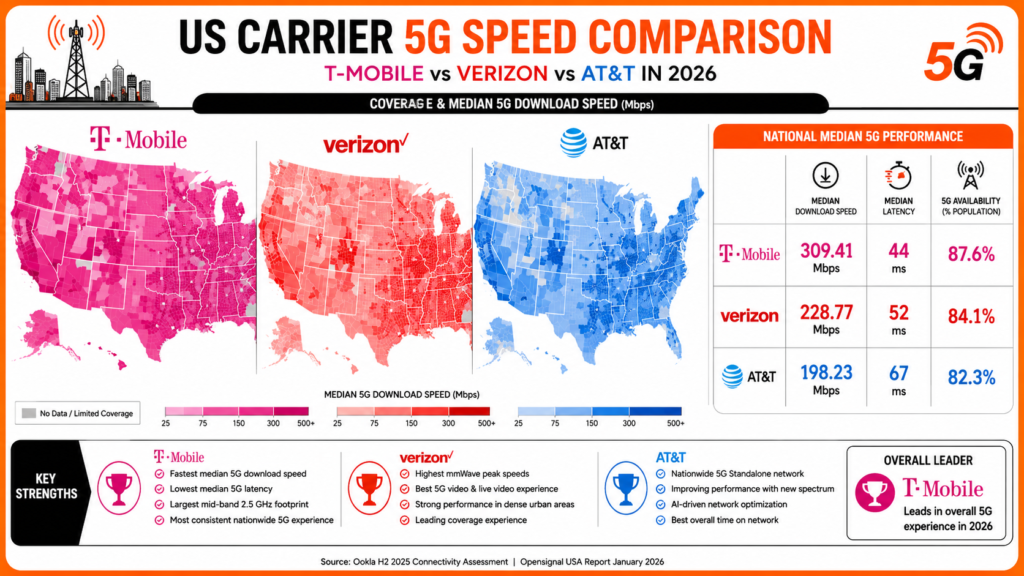
T-Mobile
Leads US 5G in nearly every category. Median 5G download speed of 309.41 Mbps. Lowest median 5G latency at 44 ms. Largest mid-band 2.5 GHz footprint. Completed the UScellular acquisition in August 2025, expanding rural coverage. T-Mobile won 12 award categories in the Opensignal January 2026 report, including 5G Availability, 5G Games Experience, and 5G Upload Speed Experience.
Verizon
Leads in 5G mmWave peak performance and 5G video experience. Its mmWave footprint in stadiums and dense urban cores still produces the highest peak speeds in the US (recorded above 2 Gbps in test conditions). Median 5G download is lower than T-Mobile because C-band mid-band coverage is still expanding. Verizon leads Opensignal’s 5G Video Experience, 5G Live Video Experience, and Coverage Experience metrics.
AT&T
Completed nationwide 5G Standalone rollout in late 2025. Its acquisition of mid-band spectrum from EchoStar is beginning to lift performance metrics in 2026. Median latency has improved every quarter from a high of 78 ms in Q3 2024 to about 67 ms in Q3 2025. AT&T has been most vocal about AI-driven network optimization. AT&T retains the win for overall Time on Network in Opensignal’s January 2026 report.
For decoding brand-name 5G labels (UC vs UW on Verizon, 5G+ on AT&T, 5G Ultra Capacity on T-Mobile), see Spenza’s 5G Carrier Branding Decoded guide.
5G for IoT: Where 5G RedCap Fits
Most IoT devices do not need 5G. Smart meters, asset trackers, soil sensors, and basic telematics run efficiently on LTE-M or NB-IoT. These low-power, narrowband technologies sip data and last years on a single battery.
5G enters the IoT picture for use cases that need more bandwidth or lower latency than LTE-M can deliver.
5G RedCap (Reduced Capability)
Defined in 3GPP Release 17, RedCap is the 5G New Radio mid-tier. It delivers 100 to 220 Mbps with 10 to 15 ms latency, at lower module cost and lower power than full 5G. RedCap targets:
- HD security and surveillance cameras.
- Industrial wearables and AR glasses for field workers.
- Retail kiosks and digital signage.
- Connected medical devices in hospitals and clinics.
- Mid-tier asset trackers that need more than NB-IoT but less than full 5G.
Full 5G (mmWave and high mid-band)
For industrial robotics, V2X, broadcast-grade video, and private 5G factory networks. Pairs with 5G SA for deterministic latency and network slicing.
For more, see Spenza’s NB-IoT vs LTE-M vs 5G RedCap guide.
Spenza’s multi-carrier MVNE platform supports the full IoT connectivity stack including NB-IoT, LTE-M, 4G LTE, 5G RedCap, and full 5G through a single eSIM profile and unified management console. This matters because deployed devices often outlive individual network generations.
A device shipped in 2026 with a Spenza connectivity profile can transition between connectivity tiers as networks evolve, without requiring firmware lock-in, SIM replacement, or supply chain redesign.
5G Mythbusting in 2026: Battery, Security, and Health
Three persistent consumer concerns, addressed with current evidence.
Does 5G drain battery faster?
Yes, slightly. Active 5G use draws 10 to 20 percent more battery than equivalent 4G use, mostly because mmWave radios consume more power and 5G modems run at higher clock rates. Modern phones from 2024 onward have closed most of this gap with better power management and Smart Data Mode features. The practical impact for most users is one less hour of mixed-use battery life per day, not a brick by lunchtime.
Is 5G secure?
5G has stronger encryption than 4G. The most important improvement is SUCI (Subscription Concealed Identifier), which replaces the persistent IMSI identifier that 4G devices broadcast in cleartext. This makes it significantly harder to track devices using rogue base stations or IMSI catchers. 5G SA also introduces enhanced authentication (5G-AKA) and end-to-end network slicing isolation. The security picture in 2026 is genuinely better than 4G.
Is 5G safe for human health?
The WHO, ICNIRP, FCC, and the equivalent regulators in the EU, UK, Japan, and Australia all confirm that 5G radio emissions within regulatory exposure limits are safe. mmWave 5G frequencies are non-ionizing and cannot break molecular bonds. No peer-reviewed evidence has shown harm from compliant 5G exposure as of May 2026.
Conclusion: 5G in 2026 Is Real but Uneven
5G in 2026 delivers measurable improvement over 4G in most US markets. Median speeds run 3 to 6 times higher than 4G LTE. Latency on Standalone 5G has fallen to 20 to 30 ms in real-world conditions, with lab targets below 15 ms. The performance gap will widen as carriers complete 5G SA rollouts and deploy more mid-band spectrum from upcoming FCC auctions (AWS-3 in 2026, upper C-band by 2027).
But 5G is not uniform. mmWave covers blocks. Sub-6 covers cities. Low-band covers states with near-4G speeds. The right tier depends on your use case, not on marketing comfort.
Consumers should evaluate 5G coverage, real-world median speeds, and latency performance in their area before deciding whether the upgrade is worthwhile. For casual users who mainly browse the web, stream HD video, or use social media, today’s 4G LTE networks still deliver a reliable experience.
Enterprise buyers and IoT product teams face a different challenge. Instead of choosing simply between 4G and 5G, the real decision is selecting the right connectivity tier, whether that is NB-IoT, LTE-M, 4G LTE, 5G RedCap, mid-band 5G, mmWave 5G, or private 5G SA. The long-term goal is building a flexible connectivity stack that can adapt as networks evolve over the next decade.
Building a connected product or fleet in 2026?
Spenza’s MVNE platform supports the full IoT connectivity stack (NB-IoT, LTE-M, 4G LTE, 5G RedCap, and full 5G) across multiple carriers, all managed through one eSIM and a unified console. Devices remain deployable as networks evolve, avoiding firmware lock-in and eliminating the need for supply chain rework when carriers shift bands.
Talk to us about your connectivity use case today