Running a single site? A dual-WAN router (one router holding your wired primary and a cellular backup) plus a business data plan solves it, and the FAQ below fills in the details. This page tackles the harder problem: business internet backup across 10, 50, or 100 locations, where the real questions are what failover should cost per site, which failure domains the backup must never share with the primary, and what breaks in the seconds after a switchover. Costs here come from published market ranges or documented outage reports; Spenza rates trace to our IoT connectivity cost benchmark.
Model your failover cost
Estimate backup data usage, recommended pooled capacity, and annual connectivity cost.
What Cellular Backup Costs Per Site (and Per Fleet)
The Cost Stack: Hardware, Plans, Licenses
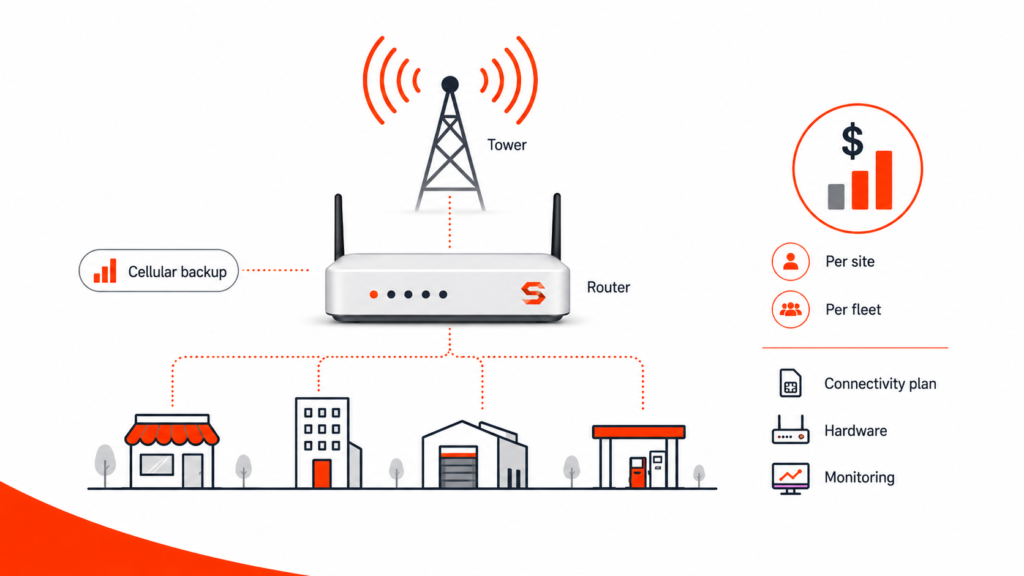
A per-site cellular backup carries four costs, and connectivity is the one your commercial model can change. Business backup plans typically run $30 to $50 per month for 10 to 20GB of LTE or 5G data. Hardware spans a wider range: dual-WAN routers with cellular start around $129 at consumer grade, cloud-managed mid-range units run a few hundred, and enterprise cellular routers pass $2,500 and add mandatory management licenses. Installation is a one-off that varies with cabling and rack access. Support is an allowance for quarterly testing and the occasional on-site visit.
Hardware and installation cost the same whether you buy one plan per site or pool data across the fleet. Spenza sells no routers, so the ranges above are the published market, not a price list we defend. That leaves the plan line, and at fleet scale it is the only line that compounds.
Why Pooled Data Changes the Math at Scale
A backup connection does almost nothing almost all the time. Its data usage is near zero except during an outage, plus a small constant overhead of health-check probes and management-tunnel traffic. Outages are rare, and across a fleet they are largely uncorrelated: an ISP delivering 99.9% availability still leaves each site dark for roughly eight to nine hours a year, but those hours land at different sites in different weeks.
The standard commercial model prices every site as if it might fail over tomorrow: a fixed monthly plan per location, bought 100 times for 100 sites. Fixed per-site plans are the incumbent revenue model, which is why no carrier will make this argument against its own pricing.
A pooled model sizes one shared data allowance for the fleet’s realistic concurrent-failover exposure plus idle overhead. Sites that never fail over stop paying for capacity they never use. Four steps keep the pool honest:
- Measure one site’s idle usage for a week. Probes and cloud-management tunnels consume real data every month, and that figure belongs in the model, not in a footnote.
- Estimate expected outage hours per site per year from your primary ISP’s actual track record, not its SLA.
- Multiply outage hours by your site type’s active-failover consumption (sizing anchors below).
- Add headroom for a regional event in which several sites fail over at once.
Two regimes, two parts of the model: pooling absorbs everyday uncorrelated outages, and the headroom step plus carrier diversity cover the rare regional event where failures arrive together.
At typical business rates of $30 to $50 per site per month, 100 sites can carry $36,000 to $60,000 per year in fixed plan costs, much of it paying for data that never gets consumed. A pooled data allowance sized around realistic concurrent usage can preserve the protection you need while eliminating unnecessary capacity and reducing wasted spend.
The 100-Location TCO Table
The comparison isolates the connectivity line; hardware, installation, and testing are identical under both models.
| Annual Connectivity Cost | 10 Sites | 50 Sites | 100 Sites |
|---|---|---|---|
| Fixed per-site plans ($30 to $50 per site per month, published range) | $3,600 to $6,000 | $18,000 to $30,000 | $36,000 to $60,000 |
| Pooled multi-carrier (sized by the four-step method above) | $480/year | $2,280/year | $4,500/year |
| What drives the difference | Idle sites carry full plans | Pooling absorbs uncorrelated outages | Pool grows with exposure, not site count |
The calculator runs this model against your own site count and outage assumptions, with every assumption printed under the tool.
Failover Architecture: The Three Modes
Every deployment lands in one of three modes.
| Mode | How It Works | Honest Tradeoff |
|---|---|---|
| Manual (cold) | Someone swaps to a hotspot or flips a link by hand | Minutes to hours of downtime; fine for nothing that matters |
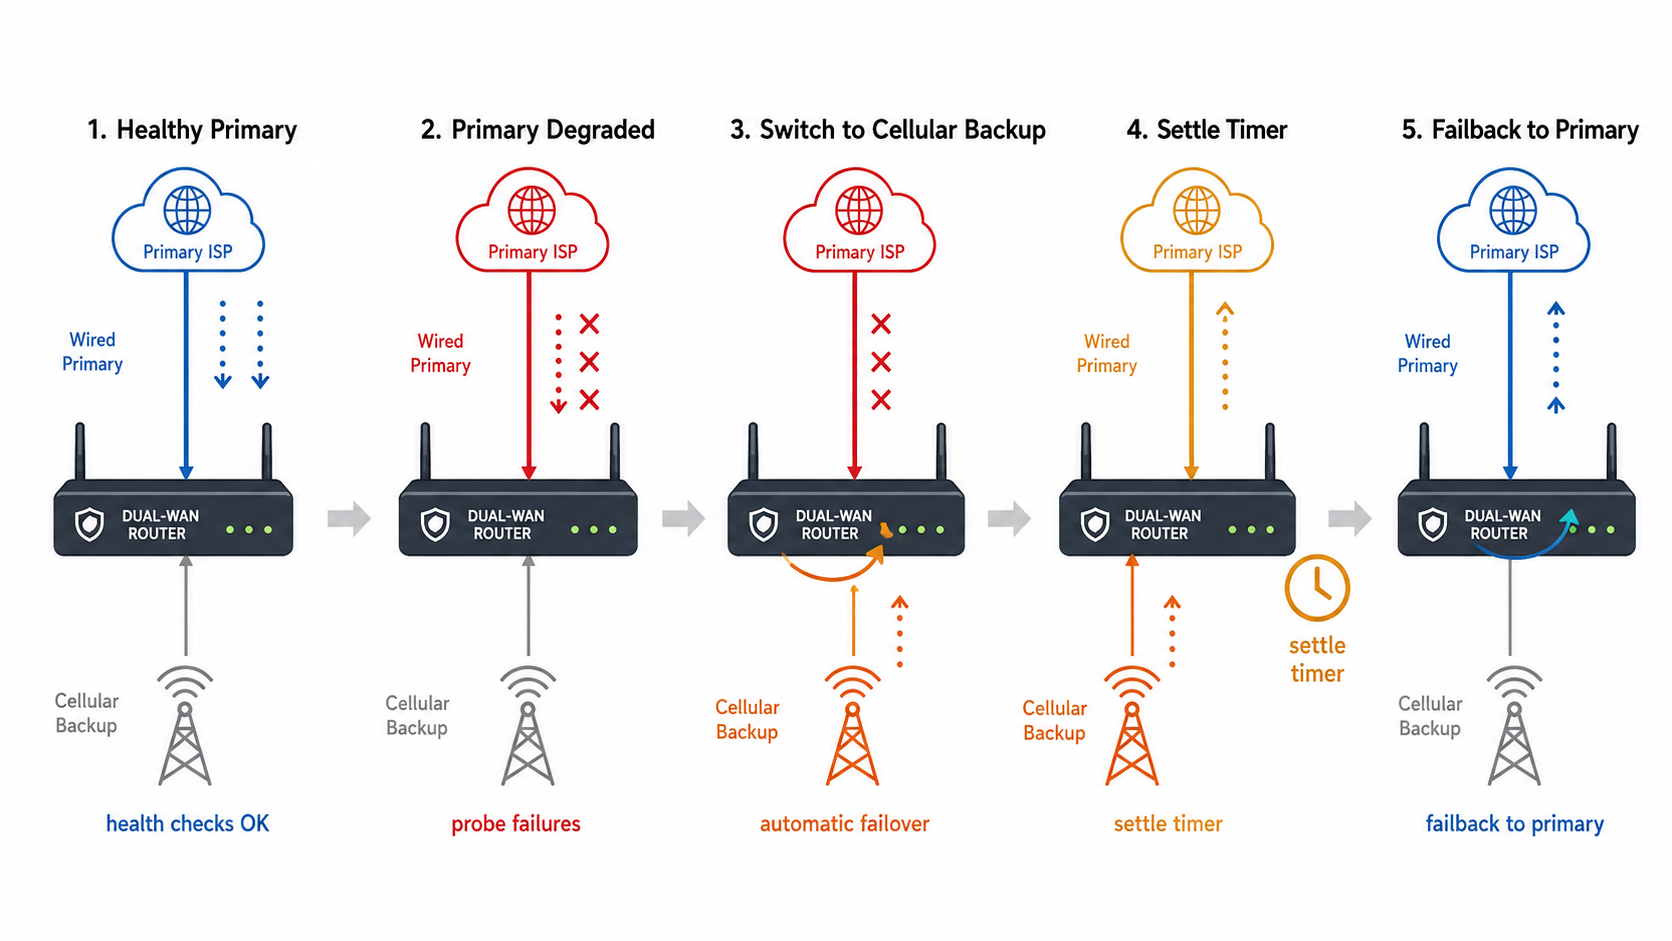
| Automatic (warm) | A dual-WAN router health-checks the primary and switches on failure | Typically 10 to 30 seconds; sessions break because the public IP changes |
| Bonded (session-preserving) | SD-WAN (software-defined networking that manages both links) or tunnel bonding keeps sessions alive | Under 5 seconds with sessions intact, at the highest cost; justified where a dropped transaction costs real money |
What Breaks When You Fail Over (and the Fixes)
On a warm failover your public IP changes, and three things follow. VPN tunnels drop and must re-establish. Calls drop and desk phones re-register over SIP (the signaling protocol behind VoIP phones), so a call in progress dies even though the next one works. Inbound access rules, the port-forwards that let remote systems reach the site, need configuring against both WAN identities, or remote access quietly fails until someone notices. Any page that implies switchover is free has not run one.
The fixes, ranked by coverage: an SD-WAN overlay or bonded tunnel preserves sessions outright. Shorter SIP registration timers and application-level retry cover most of the remainder. For card processing, modern POS terminals retry gracefully when the gap is seconds rather than minutes, which is why warm mode is usually enough for retail and bonded mode earns its cost where sessions carry revenue.
Failback needs hysteresis, a deliberate settle time before traffic returns. A flapping primary that triggers failover every few minutes is worse than a dead one, so health checks need failure thresholds on both directions of the switch.
Test your backup connection every quarter. Temporarily pull the primary connection and verify that critical services such as POS systems, phones, and VPNs recover as expected. An untested backup has an unknown probability of working, and a live outage is the worst possible time to discover that something is misconfigured.
Single-Carrier Backup Is a Second Point of Failure
A backup is only a backup if it shares no failure domain with the thing it protects. The logic applies twice: between your primary and your backup, and across the backup itself.
The Failure-Domain Checklist
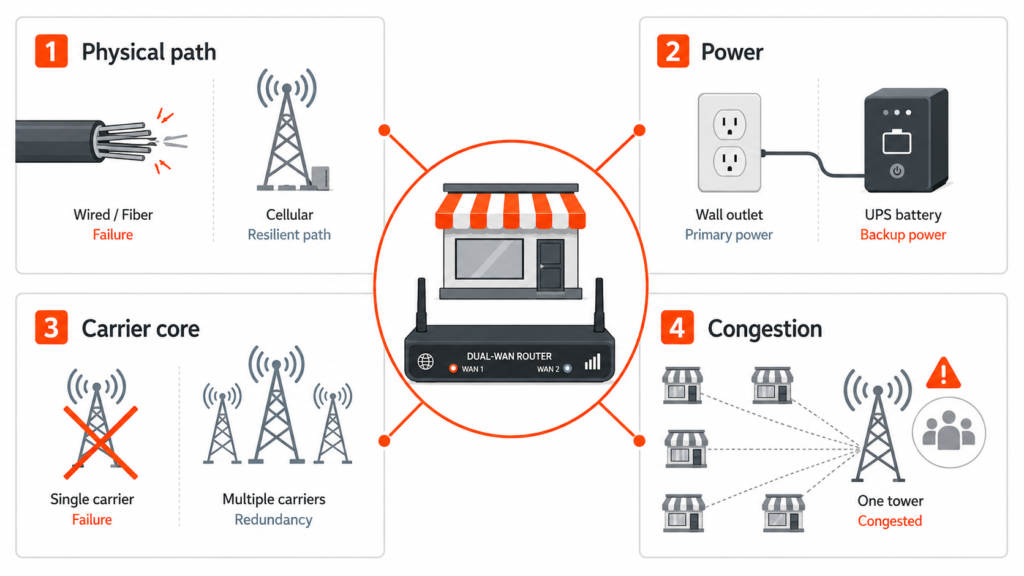
Four failure domains decide whether a backup will actually be there:
- Physical path: Cellular runs on separate infrastructure from cable and fiber, which is the standard argument for cellular backup. It is correct, and it is where most vendor pages stop.
- Power: A failover router on the same unprotected outlet as everything else dies with the site. A UPS (uninterruptible power supply, the battery that rides out a blackout) on the failover path is a one-line requirement most pages omit.
- Carrier core: A single-carrier backup makes that carrier a new single point of failure across every site at once. Major single-carrier outages are documented, recurring events, not edge cases.
- Congestion: During a regional primary-ISP outage, every affected business fails over onto the same cells at the same time. Multi-carrier selection and business-tier data priority are the honest mitigations. Nothing grants immunity.
What the Payments Outage in Canada Proved
On 8 July 2022, the Rogers network failed nationwide and took Interac debit processing down with it, because Canada’s payment infrastructure rode on one carrier. Stores sold for cash or not at all for most of a day. Interac’s response is the instructive part: it added a secondary network carrier so that no single carrier failure could take payments down again.
The pattern is not Canadian. On 22 February 2024, a misconfigured network change took AT&T’s mobile network down across all 50 US states for at least 12 hours. The FCC’s post-incident report counts more than 92 million blocked voice calls and over 25,000 failed attempts to reach 911.
If payments, alarms, or phones ride your backup, carrier diversity decides whether you bought a backup or a second copy of the same risk. Bonded multi-carrier bundles already solve this for a single store. A fleet needs the same diversity without buying it one store at a time, which is exactly what pooled multi-carrier plans are for.
How Much Data Does Failover Actually Use?
Almost none, until it uses a lot. In normal operation, a backup SIM carries only idle overhead: health-check probes, monitoring, and the always-on management tunnel of a cloud-managed router.
For the calculator, we model typical idle usage at 2 MB per site per day, or approximately 61 MB per site per month and 0.73 GB per site per year. This is deliberately small compared with active failover consumption.
During an outage, usage jumps to whatever the site actually runs through the backup connection. A QSR supporting POS, kitchen systems, online ordering, delivery platforms, and other critical cloud traffic will consume substantially more than an idle connection. That is why failover capacity should be sized by site type, outage exposure, and the workloads that must stay online, rather than using a single fleet-wide data allowance.
A 100-site retail fleet expecting eight outage hours per site per year accumulates about 800 active-failover site-hours annually. Card authorization and back-office synchronization are relatively light workloads, typically using around 1 to 5 GB per month per register even during active use, so the data pool required to cover those failover periods can remain relatively small.
The same 800 failover hours at an office where employees run full video-meeting workloads over the backup connection represents a completely different requirement. Video conferencing can consume several gigabytes per user per day, making the appropriate backup data pool substantially larger.
The lesson: size the failover pool around the actual workload, not simply the number of sites or expected outage hours.
Sizing by Site Type (POS, QSR, Office, Clinic)
| Mode | How It Works | Honest Tradeoff |
|---|---|---|
| Manual (cold) | Someone swaps to a hotspot or flips a link by hand | Minutes to hours of downtime; fine for nothing that matters |
| Automatic (warm) | A dual-WAN router health-checks the primary and switches on failure | Typically 10 to 30 seconds; sessions break because the public IP changes |
| Bonded (session-preserving) | SD-WAN (software-defined networking that manages both links) or tunnel bonding keeps sessions alive | Under 5 seconds with sessions intact, at the highest cost; justified where a dropped transaction costs real money |
For MSPs: Reselling Managed Failover
Every argument above is a product an MSP can sell. Multi-site clients want failover that survives carrier outages without multiplying plan costs; MSPs want a recurring connectivity line with margin that does not require becoming a carrier dealer. The shape of the offer: the MSP owns the router estate and monitoring it already runs, and resells pooled multi-carrier data across its client base with per-client visibility and alerts. Clients get fleet economics they cannot reach alone. The MSP prices the bundle, not the SIM.
Spenza’s platform was built for this resale model, with white-label options and per-client pooling and reporting. The commercial mechanics, margin structure included, are in our guide to reselling connectivity as an MSP.
How Spenza Powers Multi-Carrier Backup at Fleet Scale
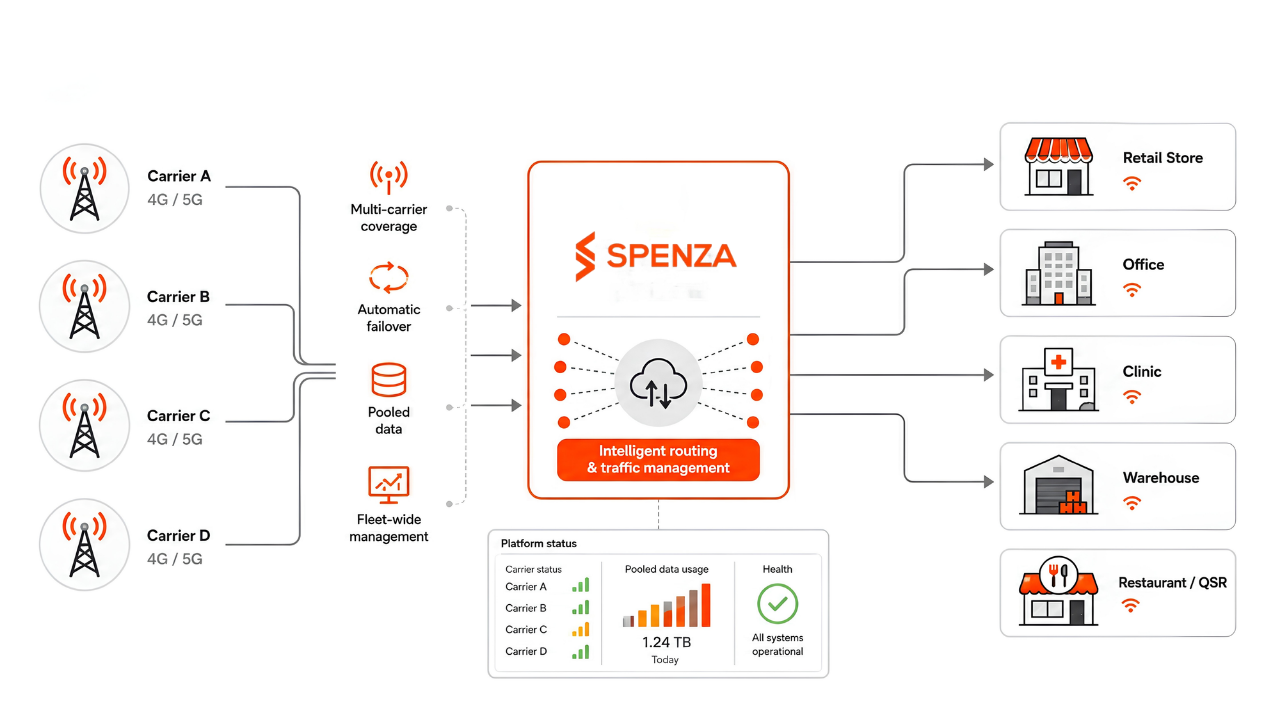
Spenza is the connectivity layer, not another router vendor. Multi-carrier SIMs and eSIMs, built on eUICC (the remotely reprogrammable eSIM standard) and multi-IMSI (one SIM carrying several carrier identities), work in the standard dual-WAN and cellular routers you already run, so the hardware advice on this page stays neutral. Data pools across your site fleet instead of being locked per location. Usage alerts catch the site quietly burning data through a misconfigured tunnel before it drains the pool. The Spenza console shows every location’s SIM status, consumption, and carrier, which turns the quarterly failover test from an afternoon into a ten-minute job.
eSIM profiles provision remotely to capable routers, physical SIMs ship where sites need them, and a 100-site rollout is a configuration project rather than a season of site visits. Come direct with your site list, or hand this page to the IT partner or MSP who runs your network; the section above covers their side of the model. No router sales, no carrier lock-in, and no uptime percentage we have not measured.
Backup or primary? This page covers cellular as your backup path. If you need cellular as a site’s primary connection, in a location fiber has not reached or a pop-up with no wired option, that is Fixed Wireless Access, and the sizing logic differs because the link is no longer idle.
Model your fleet in the calculator above, or talk to us about pricing with your site count and types.
Conclusion: Smarter Cellular Failover at Fleet Scale
Cellular backup keeps critical business operations online when the primary connection fails. But for multi-site businesses, the goal is not simply to add a backup connection to every location. It is to build a reliable and cost-effective failover strategy.
By measuring real outage usage, pooling data across locations, and using multi-carrier connectivity, businesses can improve resilience while avoiding unnecessary per-site data costs. Regular testing and traffic prioritization are also essential to make sure the backup works when it is needed most.
Use the Cellular Backup TCO Calculator above to estimate your failover data needs, compare pooled and fixed plans, and find a smarter way to keep your locations connected.
FAQs
Keep your business connected and control failover costs with Spenza. Calculate your fleet’s needs today.